
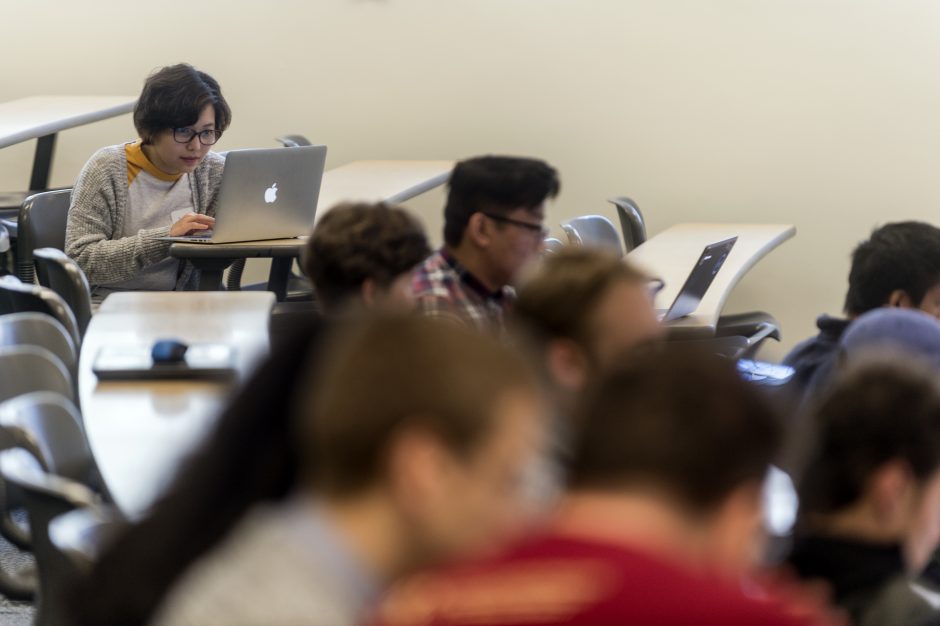
Students and data analysts gather for UBC’s third annual Learning Analytics Hackathon on Saturday, March 10, 2018. Participants worked on open data sets and proposed design visualizations for course-based initiatives in order to identify patterns in student engagement to improve learning. (Photo by Abigail Saxton)
Do UBC students need a Tinder-style app that “matches” them with possible research topics? How can we design tools that help students know if they’re on track to succeed in an online course? On March 10 and 11, students, researchers and instructors came together for the Learning Analytics Hackathon to brainstorm and prototype tools to address these questions.
Hosted by the UBC Learning Analytics project and LAVA (Learning Analytics, Visual Analytics), the Hackathon attracted more than 100 participants, who got a chance to dive deep into the world of learning analytics — a field that explores how educational data can support learning and teaching. UBC Sauder’s Learning Services provided the event space and technical support in the Sauder Learning Labs, a space that’s designed to facilitate teams in using critical thinking and analytical decision making to solve real-world problems.
“Learning analytics can be applied to answer questions about education that aren’t always as obvious at first glance,” said Johannes Harmse, UBC Master of Data Science graduate student.
He’s attended Hackathons before, but this was his first time helping out as a mentor. For Harmse, events like the Learning Analytics Hackathon are valuable for students because they provide an opportunity to get hands-on experience working in teams to solve practical problems, before entering the job market
Participants were invited to work with open learning data from Harvard and the Open University (UK) which showed how real students interacted with online course content — including how often they logged in, what resources they accessed and their grades. To protect students’ privacy, none of the datasets included information that could identify individuals.
It’s early days for learning analytics, and universities are still figuring out what instructors and students can learn from course data and the best ways to display information. UBC recently launched the Learning Analytics project to explore these questions through several ongoing pilot projects.
As Ido Roll, a senior manager at the UBC Centre for Teaching Learning and Technology explained, this year’s Hackathon is particularly exciting because students’ designs could be further developed as part of the Learning Analytics project.
“UBC can learn a lot from what you design,” Roll told Hackathon participants. “At the moment, most universities’ learning analytics designs are for instructors and researchers. We don’t see a lot of designs for students.”
One of the tools that will be piloted at UBC includes a dashboard that lets students compare their activity in an online course with (anonymized) students who performed well in previous semesters.
“A student may find they’re on track in terms of how much time they’ve spent on readings, but that they’re behind in the discussion forums, compared with students who have done well in the past,” said Sanam Shirazi, a LAVA member and one of the Hackathon’s organizers.
After two days of workshops and hacking, teams shared their results, discussing what they learned and challenges they encountered.
Third-year UBC Statistics student Robin Xie said he came away from the Hackathon with a better understanding of R, a statistical computing and graphic software environment used for data analysis and visualization.
“I learned how to use the [R] package Plotly to create interactive graphs that allow users to explore the connection between two variables within the dataset,” he said.
As part of his team project, Xie created an animated circle plot that visualizes student engagement within a course, as measured by number of clicks.
“Users are able to interact with a slider that [shows user] activity at a particular time point,” he explained.
The team had just two days bring their ideas to life, and with more time, future iterations of the tool could show detailed data about which activities students are clicking on and how that changes over time, he said.
As a UBC Data Science graduate student, Nazlı Özüm Kafaee already has considerable experience with data analysis, but says she also took a lot away from the weekend. “I learned some very useful techniques that I was not even aware of,” she said.
Kafaee says she particularly appreciated the Hackathon’s emphasis on creativity and brainstorming, and the opportunity to examine data without constraints or pre-determined objectives.
“I really liked how it forced us to look at the data holistically and think of all kinds of information that can be extracted from it,” she explained.
This was Kafaee’s first Hackathon, and she says it “absolutely” won’t be her last: “I’m definitely going to follow similar events in the future.”